For many enterprise grade applications, providing a point where you can access in-depth analysis about your data has become a crucial feature. There are many approaches to this - you can build you own web application and backend that has views allowing customers to filter and analyse data. Alternatively, you can use the embedded analytics capabilities of Looker, Tableau or Sisense - all of which are large business intelligence tools, with a host of features and connectors into all sorts of data sources.
But if you’re already on AWS, then it really is worth considering QuickSight to present analytics in your web application.
This series will guide you through the intricacies of creating a multi-tenant solution with QuickSight, dealing with data security across customers and within organisations. We’ll need to go beyond to AWS console, and dive into the CLI/API commands that you’ll need to manage all of this.
First we’ll start with a more general and gentle introduction into QuickSight. This article will show you how to create an AWS Lambda function using AWS Chalice that periodically places data in S3, build a QuickSight dataset from this, and then visualise the data on a dashboard. We’ll use this dashboard for later installments in this series when we move to embedding the dashboard on a web application and go through some approaches to secure the data.
A Brief History of QuickSight
AWS launched QuickSight at re:Invent 2015, introduced as a solution that gave “very fast, easy to use business intelligence for your big data needs at 1/10th the cost of traditional on-premises solutions.”. The pricing was the key differentiator here: to this day all BI tools are expensive, while QuickSight takes the approach of Pay-Per-Use, with a usage cap.
At re:Invent 2020, AWS announced a session capacity pricing model which might appeal to more customers. In short, you can either worry about provisioning and managing QuickSight users, or you can buy session bundles and provide dashboards in your web applications without needing to do user provisioning. It reduces the amount of user management and authentication required, and while it initially costs a little more per session, this reduces as customer commit to more sessions.
Under either model, the definition of a session in QuickSight remains the same: a 30 -minute interval where a reader can access dashboards and interact with data. Sessions are charged at $0.30 per session, maxing out at $5 per month.
If you were to take the Session Capacity Pricing model, this will range from $0.40 to $0.16 per session depending on your annual commitment. You can get all the details on the QuickSight Pricing Page.
QuickSight Versions
There are two different editions of QuickSight available, Standard and Enterprise. For most cases, you’ll want to go to Enterprise as it provides the ability to work with Embedded Analytics, provides secure data encryption at rest and provides Row Level Security.
Depending on which version you choose, the price for a QuickSight author will vary. Author pricing is $9 per month for Standard or $18 per month for Enterprise with an annual commitment. It’s likely you’ll have many authors in your organisation; make sure that you keep an eye on your AWS monthly bill to make sure you don’t have any inactive author accounts, as it’s obviously a waste of good money!
Creating Your QuickSight Account
First of all you’ll want to get things ready in QuickSight, at https://quicksight.aws.amazon.com/
If you haven’t already signed up for QuickSight on your account, you’ll be prompted to do so

When you sign up, you’ll have the choice of two editions - Standard or Enterprise.

You’ll need to go enterprise if you want to use features like Row Level Security, which allows you to use a single dataset for a set of users, and manage what each of the users can see. Each user will get assigned to a group, and each row in the dataset can be decorated with privileges for that row. We’ll get into this more in a later article in the series.
On the next page you’ll need to choose a few more settings such as an account name and a region. You will also need to handle how to manage user authentication. Unless you are using Active Directory, you will likely want to choose the first setting. In this tutorial, we’ll be using QuickSight-managed users.
All of the other settings related to services that QuickSight can connect to can be changed later.

Your First Dataset
Finally, let’s get a dashboard set up, and before you can visualise anything, you’re going to need a dataset. There’s a huge amount of input options available which you’ll see when you click on New Dataset

It’s very likely your first instinct is just to select the “Upload a file” option, and take a CSV/Excel file to create a visualisation. That’s not so bad, and it’s a good way to get to grips with what’s possible. However, you’ll get caught out with the lack of automation: while you can manually (and a little painfully) replace data, it should only be used for validation and proof of concepts, and not be relied on for live data.
Instead, we’ll take a look at the close second to simplicity - hooking into a dataset that’s up in S3. Of course, first, we’re going to need to get some data processed and stored in S3. Time for some data prep with AWS Lambda!
AWS Lambda DataSet
To get some data into S3, we could have just dropped some files into a bucket, but what fun is that? Instead I created a simple Lambda that will look at a dataset related to COVID-19 and make that available in S3 for a QuickSight dataset .
The data I’m using is a copy of the CSV from Our World In Data on GitHub -> covid-19-data/us_state_vaccinations.csv at master · owid/covid-19-data · GitHub
There are many ways out there to create Lambda functions, but for this example I used Chalice, a framework for writing serverless apps in Python from AWS. It’s pretty straightforward, and allows you to focus on the core areas of your application.
You can view the full source on GitHub here
Of course, if you take a copy of this code, you’ll need to add in your own bucket name, as they’re globally unique. You’ll need to add it to the environment variable in config.json and also ideally in the ARN of your policy-dev.json .
All that we do in the root of the application is use pandas to read the CSV directly from the url in GitHub and save that CSV to S3. Yes, we could have avoided pandas for this specific workload, as we’re not doing any real processing in the Lambda function. But it’s most likely you will want to do some transformations, and pandas is the best at this.
As you can see the code is really straightforward
 url = 'https://raw.githubusercontent.com/owid/covid-19-data/master/public/data/vaccinations/us_state_vaccinations.csv'
    dataframe = pd.read_csv(url)

    s3 = boto3.resource('s3')
    s3.Bucket(environ.get('BUCKET_NAME')).put_object(Key='us-covid-vaccination-data.csv', Body=dataframe.to_csv(index=False))
Some other points of interest using Chalice:
Scheduling
If you wanted to schedule the function to run once a day, or at any interval, all you need to do is replace the annotation and parameters for the function, changing to:
@app.schedule(Rate(1, unit=Rate.DAYS))
def prepareData(event):
Managing Policies
Rather than having Chalice manage the iam_policy itself, you can define a policy (see policy-dev.js) to give access to both S3 and to QuickSight from this Lambda. See Configuration File — AWS Chalice for more details. In this example the function need access to logs and to the S3 bucket
{
    "Version": "2012-10-17",
    "Statement": [
        {
            "Effect": "Allow",
            "Action": [
                "logs:CreateLogGroup",
                "logs:CreateLogStream",
                "logs:PutLogEvents",
                "ec2:CreateNetworkInterface",
                "ec2:DescribeNetworkInterfaces",
                "ec2:DeleteNetworkInterface"
            ],
            "Resource": "*"
        },
        {
            "Effect": "Allow",
            "Action": [
                "s3:PutObject",
                "s3:PutObjectAcl"
            ],
            "Resource": "arn:aws:s3:::js-covid-data/*"
        }
    ]
}
Environment Variables
It can be pretty useful to use environment variables in Lambda functions. In Chalice, you can add these to the environment_variables section of config.json, and access them in Python through os.environ. In the example here, I use it for the bucket name . See Configuration File — AWS Chalice for more details
Deployment and Execution
To deploy you function, just run the following command
chalice deploy --stage dev
You can invoke the function from the AWS console, or directly from the terminal like so:
chalice invoke --name prepareData
After invoking the function, make sure that you’ve got content in the S3 bucket.

Hooking the S3 Data Into QuickSight
QuickSight has so many datasources, you’re going to be able to create your dashboard from almost anything! To see the extent of what you can do, just click through to Datasets and press the New Dataset button and choose from one of the dataset types.
For this example, I’m going to keep things really simple and use the S3 datasource. If you wanted, you could just visualise a datasource directly from an uploaded file, but you’ll quickly find limitations there, particularly if you want the dataset to refresh.
You’ll need to give QuickSight access to the S3 Bucket, which you can do through the QuickSight management interface which you’ll get at through the drop down on the top right corner of the QuickSight page. Go to Security & permissions and click on Add or Remove

From there you can simply click on the S3 bucket that contains data you want to visualise.
To actually hook in the data source, you simply need to create a manifest file that points to the file in the bucket. There are two ways that you can do this - point direct to a single file, or point at a bunch of files that fit a particular naming pattern. This pattern approach can be useful when you break up files by day_week, rather than having huge files in S3. It all depends on your use case. Just to illustrate this, the manifest in this example points to any file that starts with /us_covid_
{
    "fileLocations": [
        {
            "URIPrefixes": [
                "https://js-covid-data.s3-eu-west-1.amazonaws.com/us-covid"
            ]
        }

    ],
    "globalUploadSettings" : {
        "format": "CSV",
        "textqualifier": "\""

    }

}
Use this manifest to create a new S3 data source as follows:

Then click on Edit/Preview data once this is complete

This brings you to the data preparation area, where you will need to save the dataset. We’ll come back to this soon - click on Save for now.

Refreshing DataSets
If you have your Lambda function running on a schedule to put data into your S3 bucket, you have two options - the console or the API.
To use the console, you can click on the dataset, and click on Schedule refresh to choose Hourly, Daily, Weekly or Monthly refreshes.

You could also control the data refresh on a dataset using the CreateIngestion API. The benefit to this is that you can set your lambda to refresh the dataset directly after the content is copied to S3, provided you update the policy to allow access to the QuickSight API. To do this from Python is quite simple:
    quicksight_client = boto3.client('quicksight')
    ingestion_id = str(uuid.uuid4())
    response = quicksight_client.create_ingestion(DataSetId = dataset,  IngestionId = ingestion_id, AwsAccountId =ACCOUNT_ID)
The ingestion id must be unique per execution (hence the uuid). The dataset id can be extracted from the console when editing the dataset - it’s the long set of characters in the URL:
https://eu-west-1.quicksight.aws.amazon.com/sn/data-sets/<DATASET ID>/prepare
One really important thing to note here is that you are limited on the amount of times you can refresh a single dataset daily. At the time of writing, the limit is 32, so you can only update every 45 minutes.
I would recommend leaving this to be hourly however, to allow for additonal manual adhoc refreshes.
At Last, A Dashboard
We’ve done a lot, but the point of this article is to build a dashboard. You’ll first create an Analysis, and then publish that to a Dashboard that can be embedded into an application later. Just select New Analysis from the Analyses list, and choose the dataset you want to create the analysis from.

Using the visual editor is a whole other topic, so we’ll just skim. To deep dive into this, just check out the QuickSight User Guide. Before you go read that, here’s a crash course in visualisation using this data set.
How Many People Are Fully Vaccinated Out Of the Total Vaccinated
To create this, you can just create a KPI visual where the target value is the people_vaccinated attribute, and the value is the people_fully_vaccinated value

Filter the dataset by Location
Each state is represented by the location attribute, so adding that as a filter can help focus down the dataset. Click on the Filter button the left hand side, and choose locationas the filter attribute, applying to All Visuals of the dataset. Add this to your sheet to make it usable in the dashboard

You can move your filters that are added to the sheet to any location. Now you can select one or more states to view details for

There’s also a date attribute that you could add to view data for a given date range.
Vaccination Trends
Using a line chart, you can plot the number of people vaccinated vs the number of people fully vaccinated by date. Click on that date field to adjust the aggregation.

Add Insights
Finally, with the line chart visual selected, click on the Insights button on the left hand side to find auto-generated insights that Quicksight has created for you. This section provides you with everything from the simple data insights, such as the highest and lowest days, to pretty impressive forecasting metrics.. These can then be added to your analysis.

The forecast looks a bit blunt initially - not very user friendly:

Luckily there’s an editor available under “Customise Narrative”. By removing some automatically substituted variables, you can make them look and sound a whole lot better

Changing The Look & Feel
You can change the overall colours and style of the analysis using the Themes menu. There are a few starter themes, but you can customise these and save them as your own theme for later use. Find out more about Themes in the QuickSight documentation.
Each of the widgets can be customised too, changing titles, fonts and more.
Filtering The Dashboard Using Visuals
You can add Actions to any visuals to make the graph clickable, and to cause the rest of the dashboard to filter based on the selected value. This can be a much more intuitive way to interact with your data, and can reduce the amount of traditional filter controls (dropdowns, search bars etc).
To try this out, create a TreeMap using the location and the sum of people_fully_vaccinated

Click on the three dots at the right hand side of the visual, and select Actions., and use the ‘Quick Create’ option to filter same-sheet visuals
Now you can quickly navigate through the states by clicking on the tree map visual.

There’s a whole lot more that we could do with this dataset, but I think you get the idea.
Publishing Your Dashboard
To publish your dashboard, click on Share on the top right hand corner of the analysis and choose Publish Dashboard

After doing this, you’ll be prompted to share your dashboard with other users, groups or email addresses. No need to do that just yet.
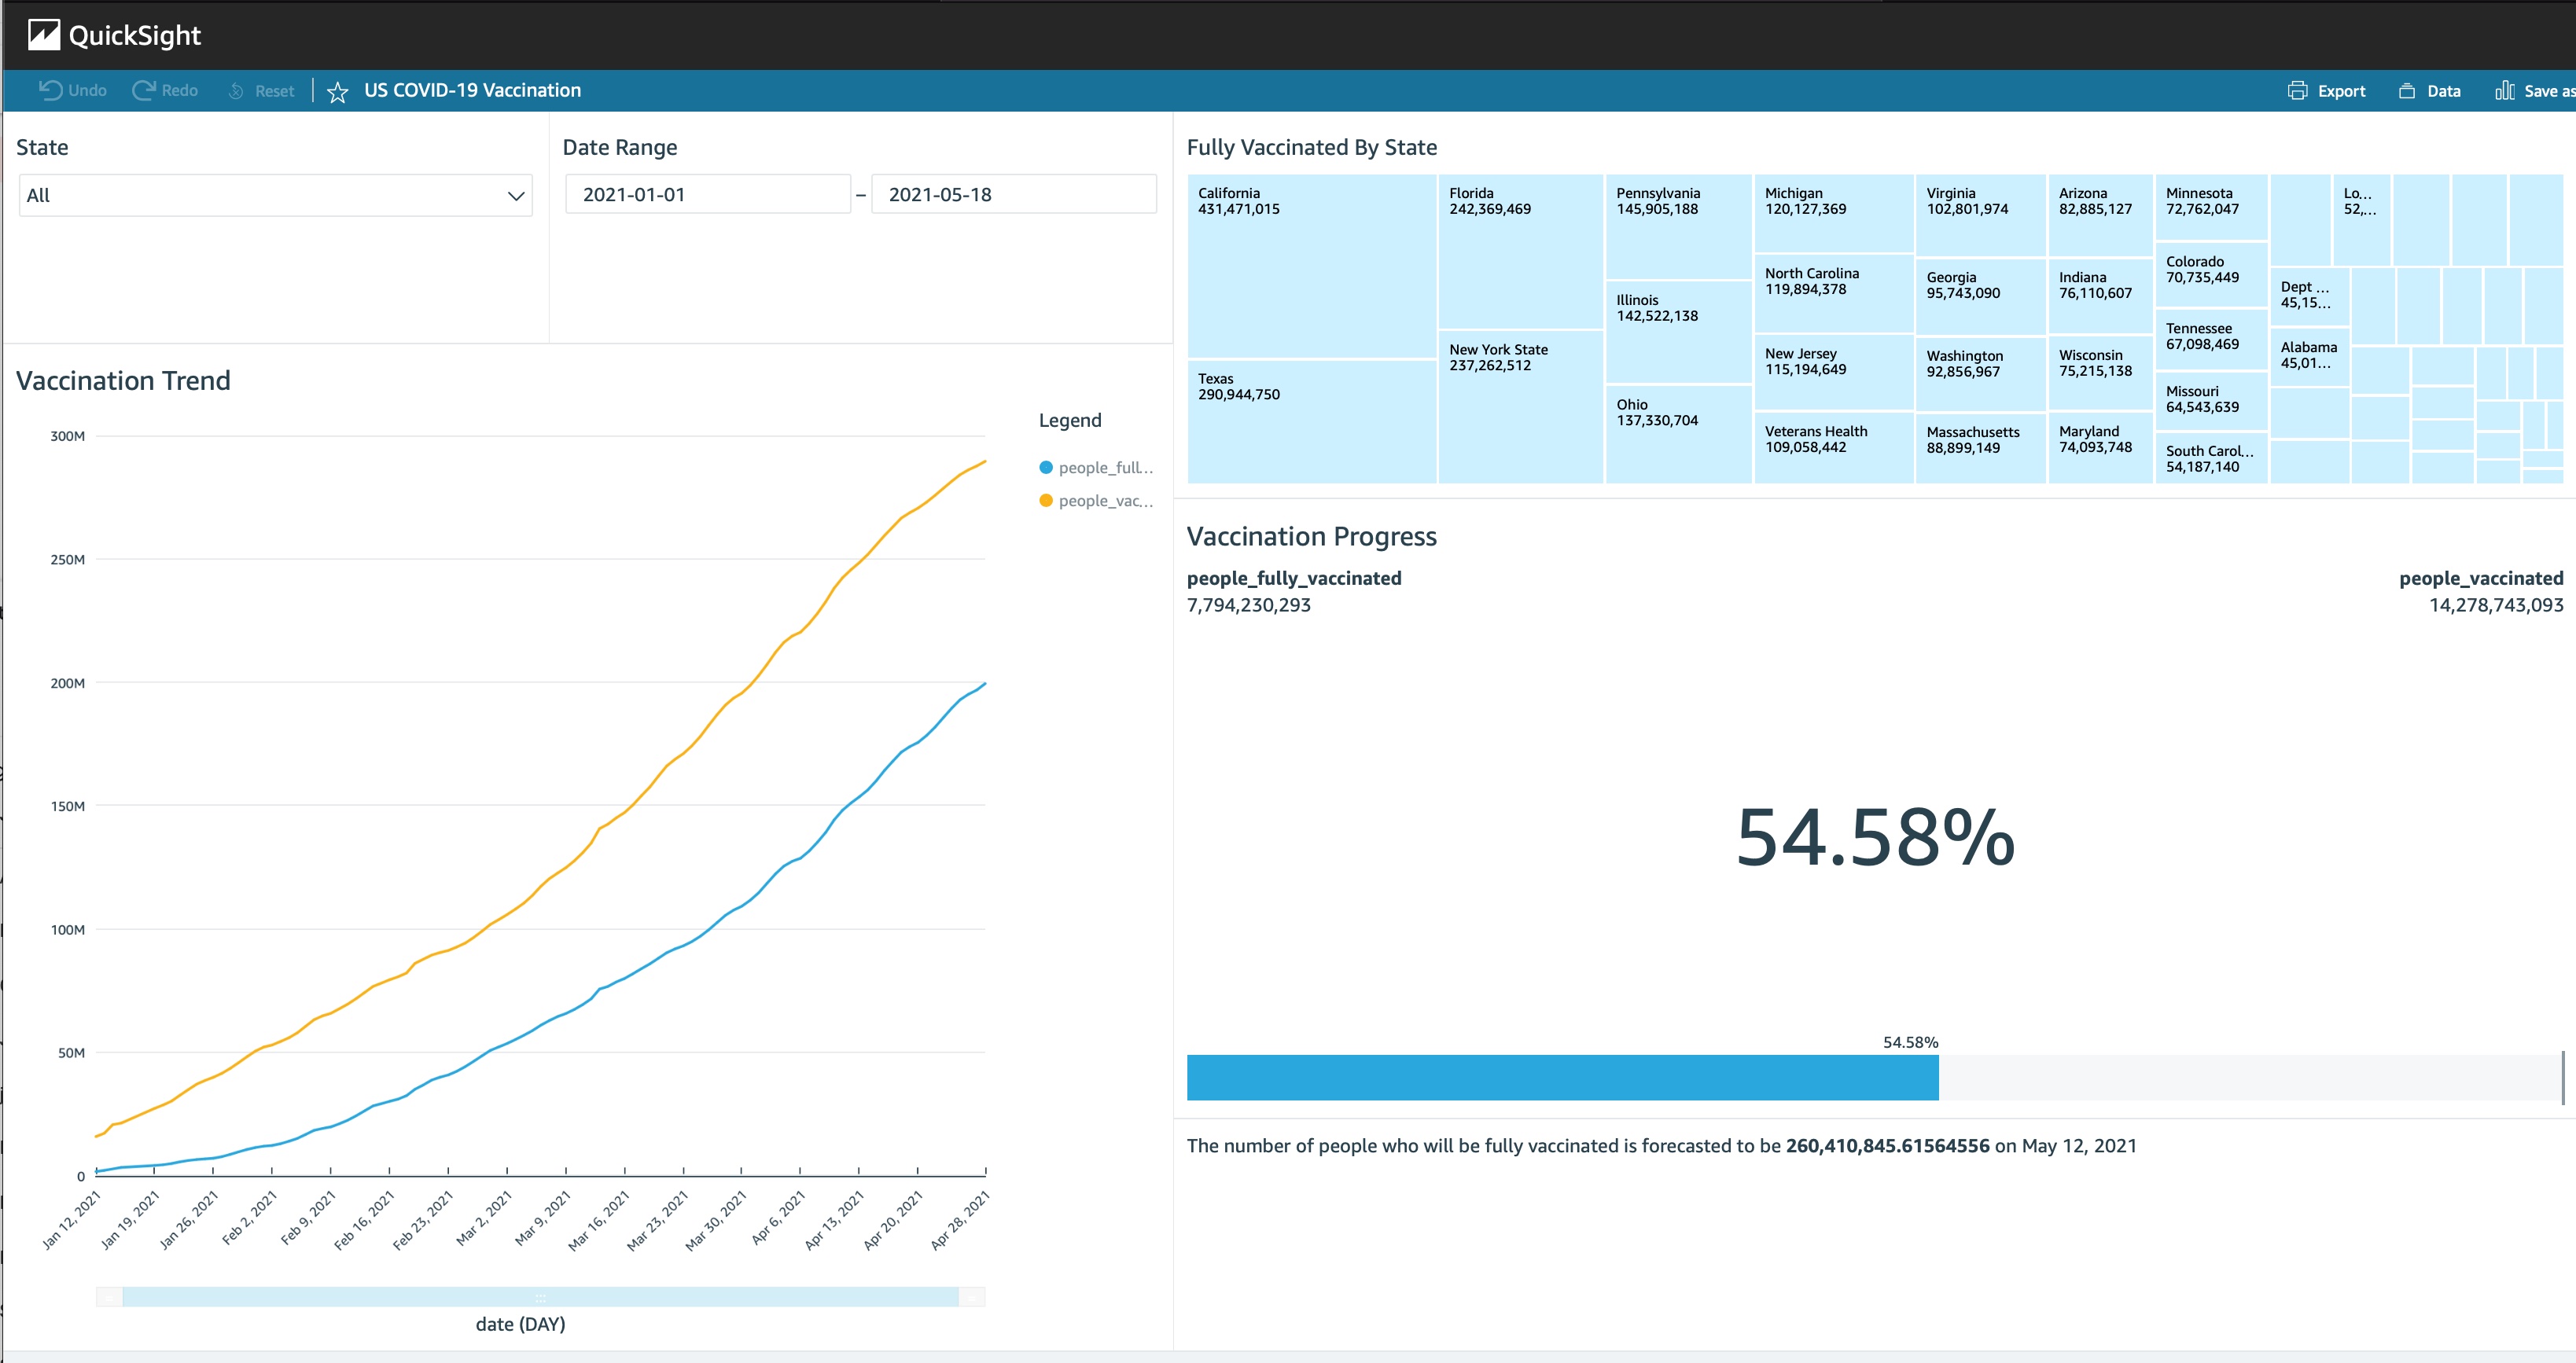
Here’s how it looks

Next Time
In the next instalments in this series we’ll look at how to:
- Embed the dashboard we just created in our own web application. We’ll bring Amplify into the equation.
- Work with the QuickSight API to operationalise some of the work we’ve done.
- Show how to use namespaces and groups to manage access to dashboard, and use row level security to ensure data security.
Useful Resources
The following links will help you along your QuickSight journey
QuickSight Developer Portal Amazon QuickSight YouTube Channel QuickSight User Guide